
February 17, 2026 · Market Report
The Market Pulse: A Pivotal Moment
January didn’t exactly burst out of the gate. If 2026 was supposed to be the Year of the Fire Horse, the Seattle market started more like a trot. Momentum is building, it just hasn’t left the gate yet.
Inventory has expanded to levels not seen in recent years, prices have stabilized, mortgage rates are trending lower, and buyer demand remains active — though far more selective than in prior cycles. The market is functioning, but it is no longer forgiving. Strategy now matters more than speed.
Thirty-year fixed mortgage rates have eased into the low-6% range, currently 6.09% per Freddie Mac (February 12, 2026). That restores roughly 8–10% in purchasing power compared to mid-2025.
Yet many buyers remain hesitant. Job market uncertainty headlined by slowdowns and cuts at major employers like Amazon and Meta in 2025 has prompted a more deliberate approach. On Sunday we received the BLS’s bombshell jobs revision: U.S. employment growth for 2025 was slashed by a record 1,029,000 jobs. This is the largest annual downward adjustment in over 20 years.
That recalibration reinforces what many of us have felt on the ground. Even those with stable jobs are touring longer, comparing options, and waiting for clearer economic signals before committing.
Introducing: The Market Pulse
Closed data tells you where the market was. Active and Pending data tells you where it’s going. After 17 years in this business, you learn to develop a sort of 6th sense. The tone of a buyer. The cadence of showings. The urgency in negotiations. A professional knows well before the data confirms it.
So what is the “Market Pulse”?
We built The Market Pulse to quantify that intuition — a real-time, back-tested index measuring active and pending activity, velocity metrics, all standardized for a more accurate snapshot and evaluation of the momentum in the market, past, current, and future. This tool is especially valuable for our sellers and builders as it will allow you to make informed decisions at the leading edge of potential market shifts allowing you to stay ahead rather than chasing from behind.
We can’t change the market’s direction, but we can give you a comprehensive understanding of how things look under the hood and custom tailor a strategy accordingly.
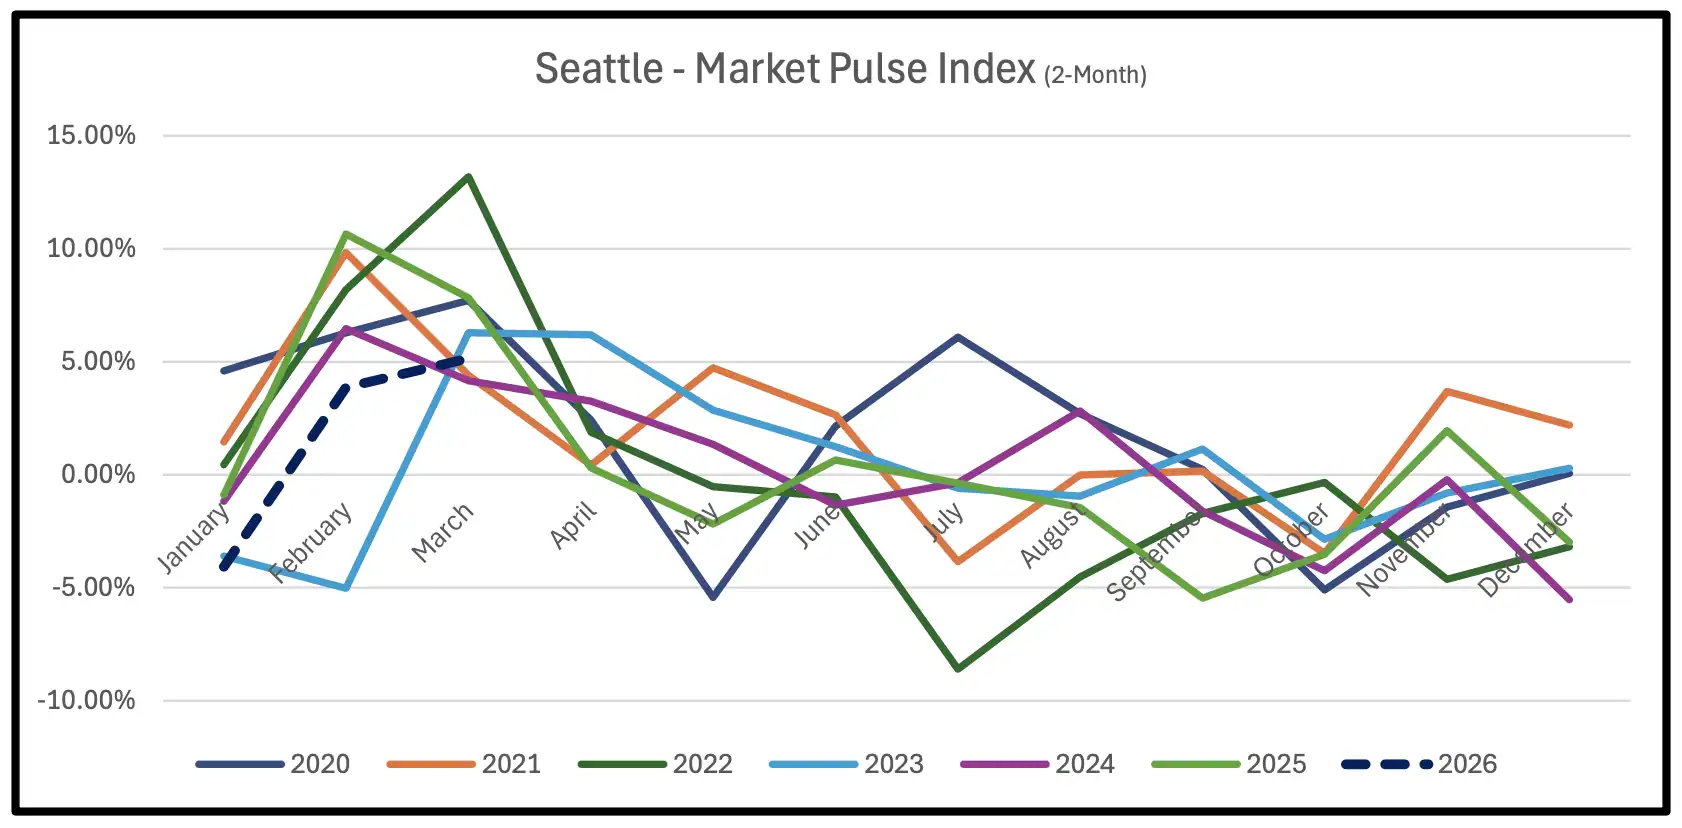
Back testing the data on last year, the Pulse reading was flashing caution by March, and confirmed in April a momentum level slowdown comparable only to 2022’s rate shock and the early 2020 COVID slowdown.
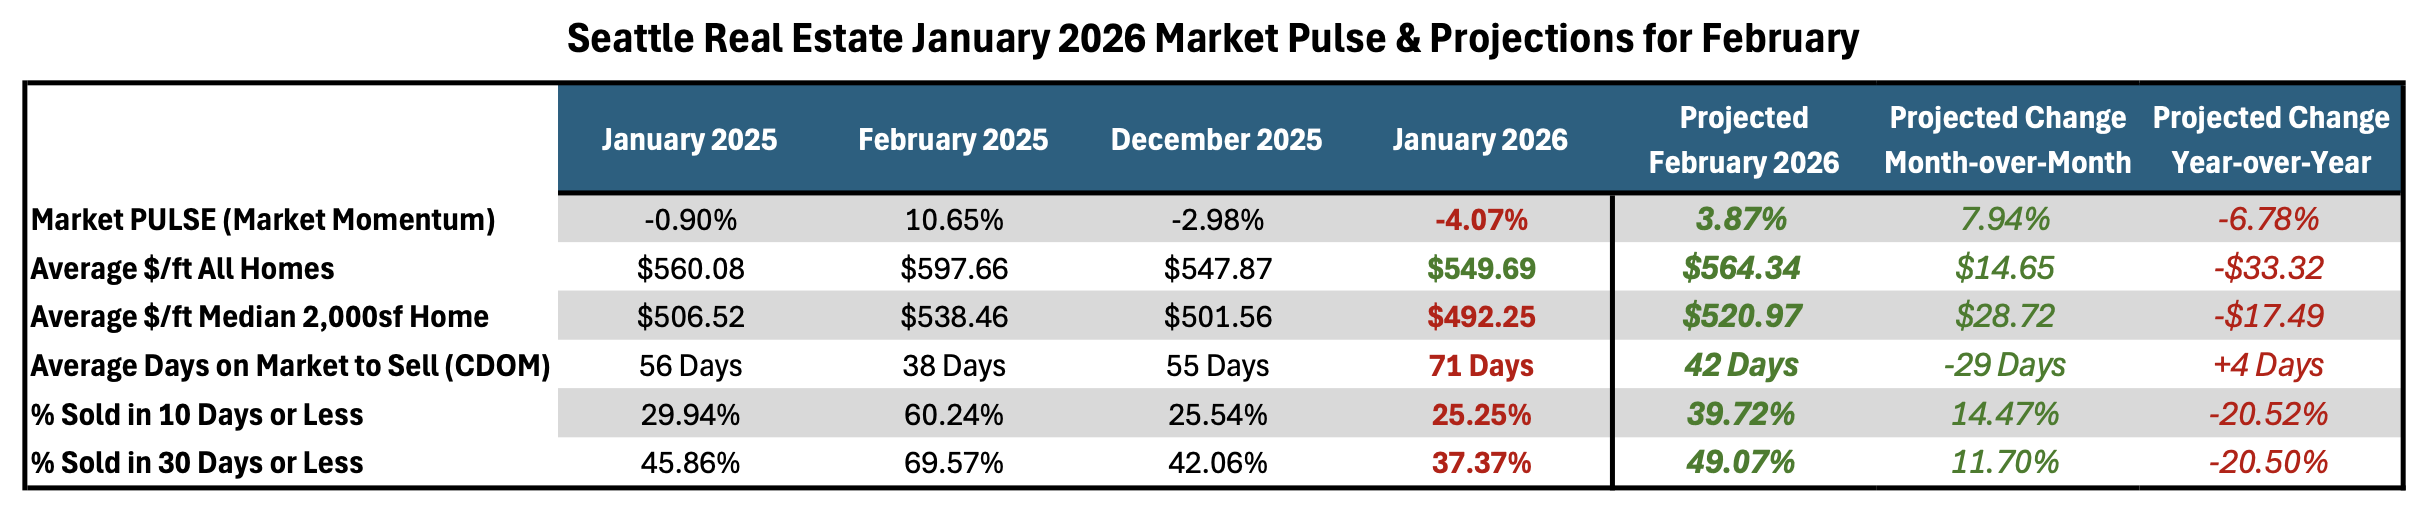
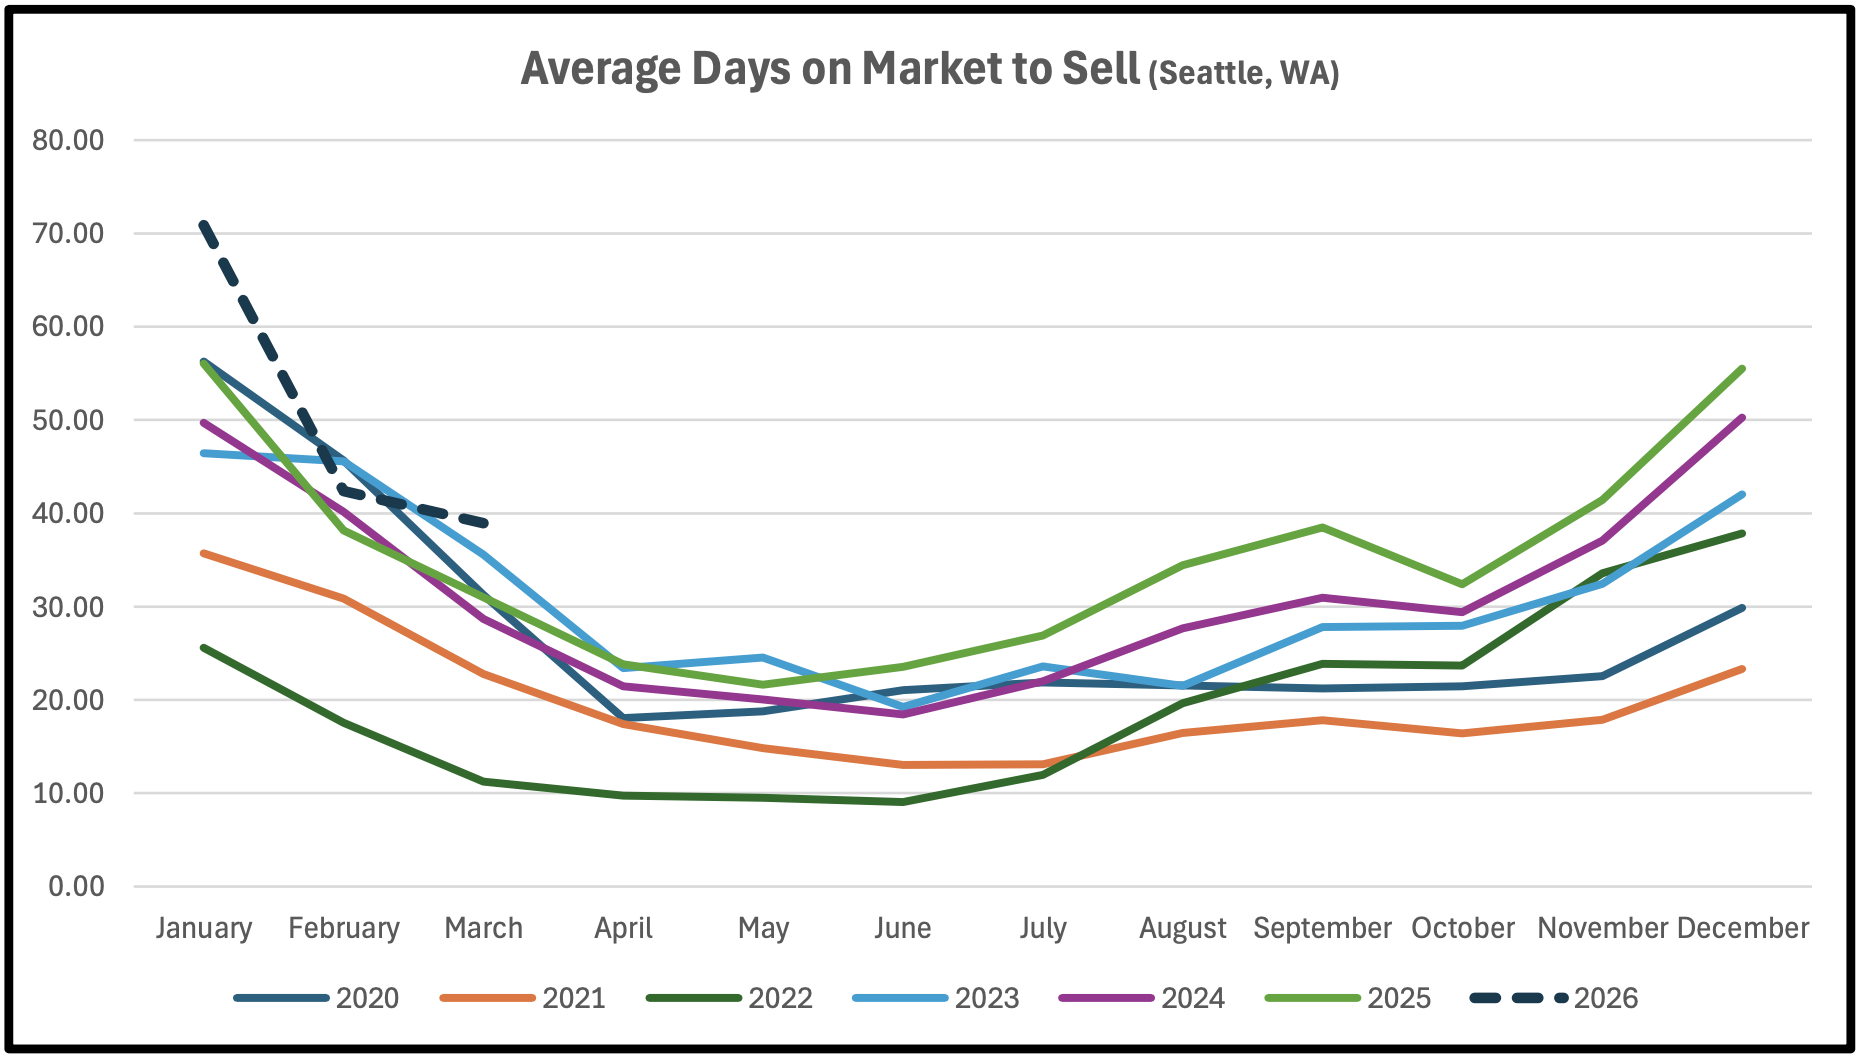
In January 2026, the Pulse reading registered a -4.07%, following December’s -2.98%. That reflects absorption lag from 2025’s inventory expansion with average cumulative days on market for sold homes stretching to 71 — the longest we’ve seen in over a decade!
Looking forward, February pending projections are rebounding with a projected Pulse reading of 3.87%, still below prior years but momentum is slowly improving. As Active and Pending data for March has trickled in, we are projecting a preliminary Pulse reading of 5.15% which is better, but still below levels seen in previous years.
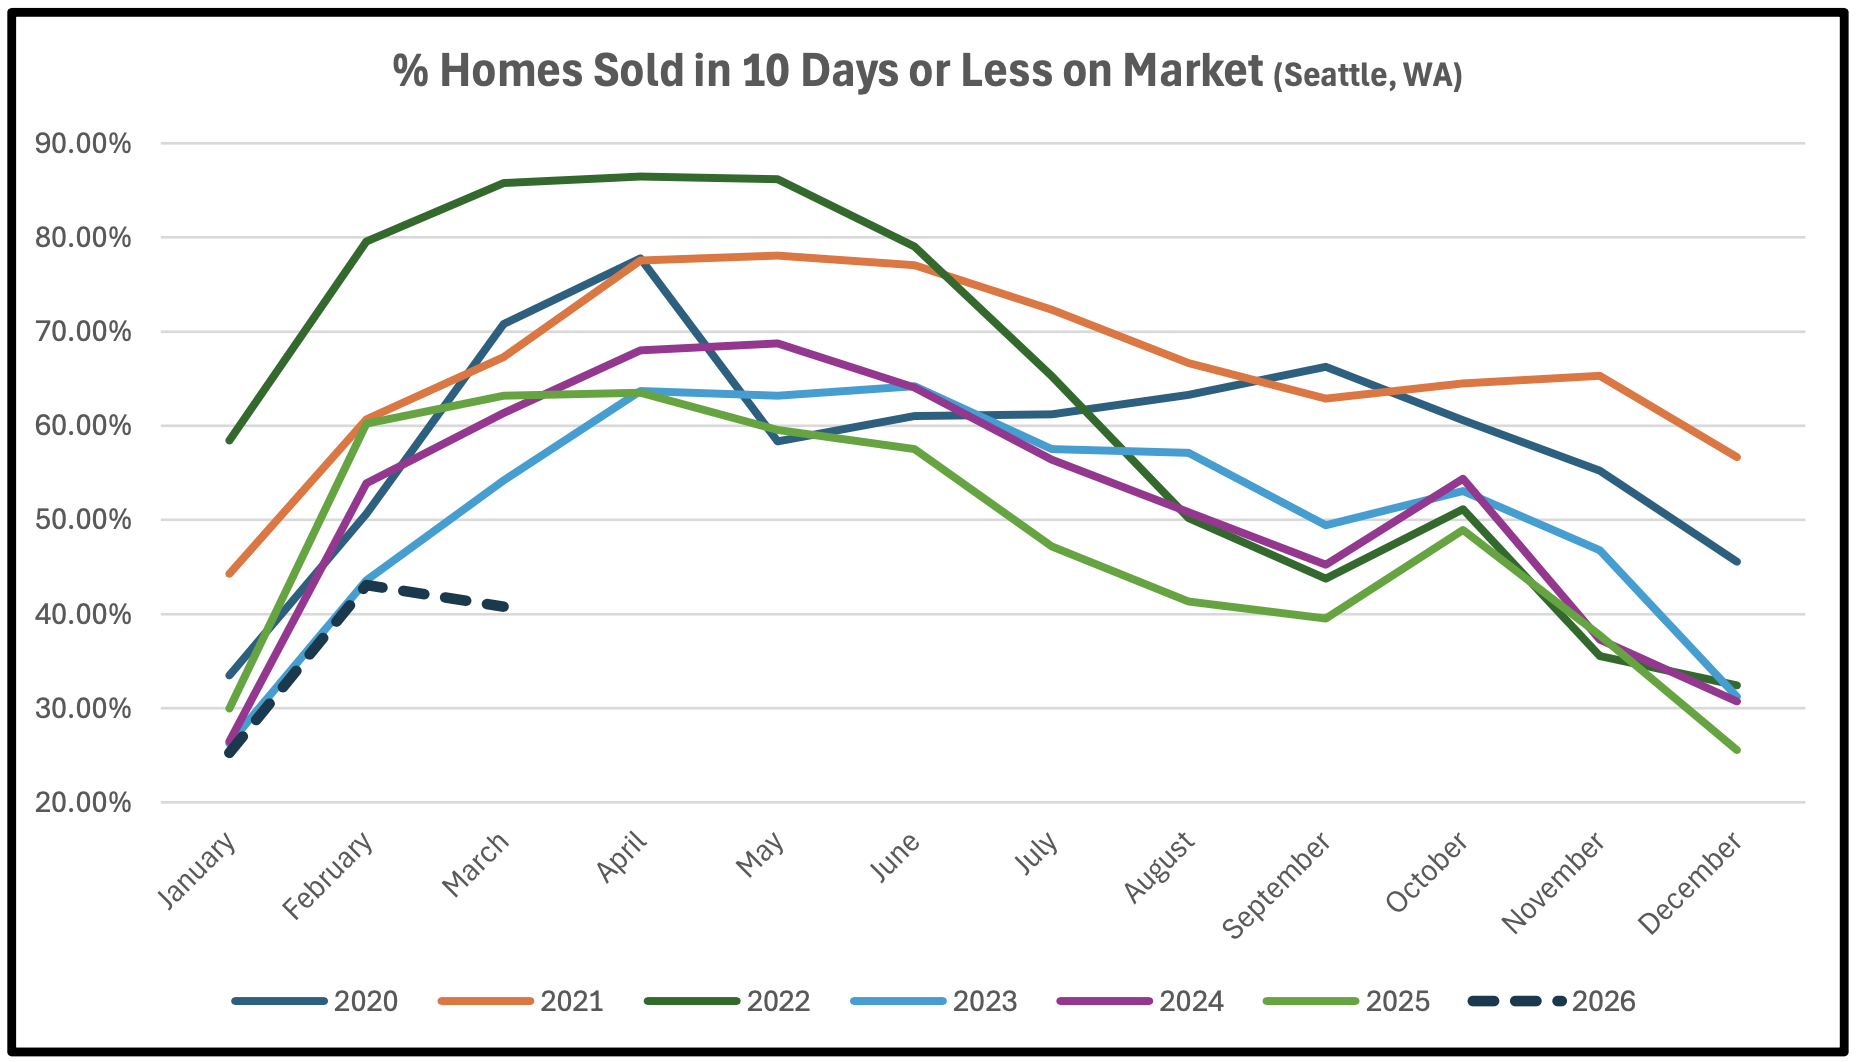
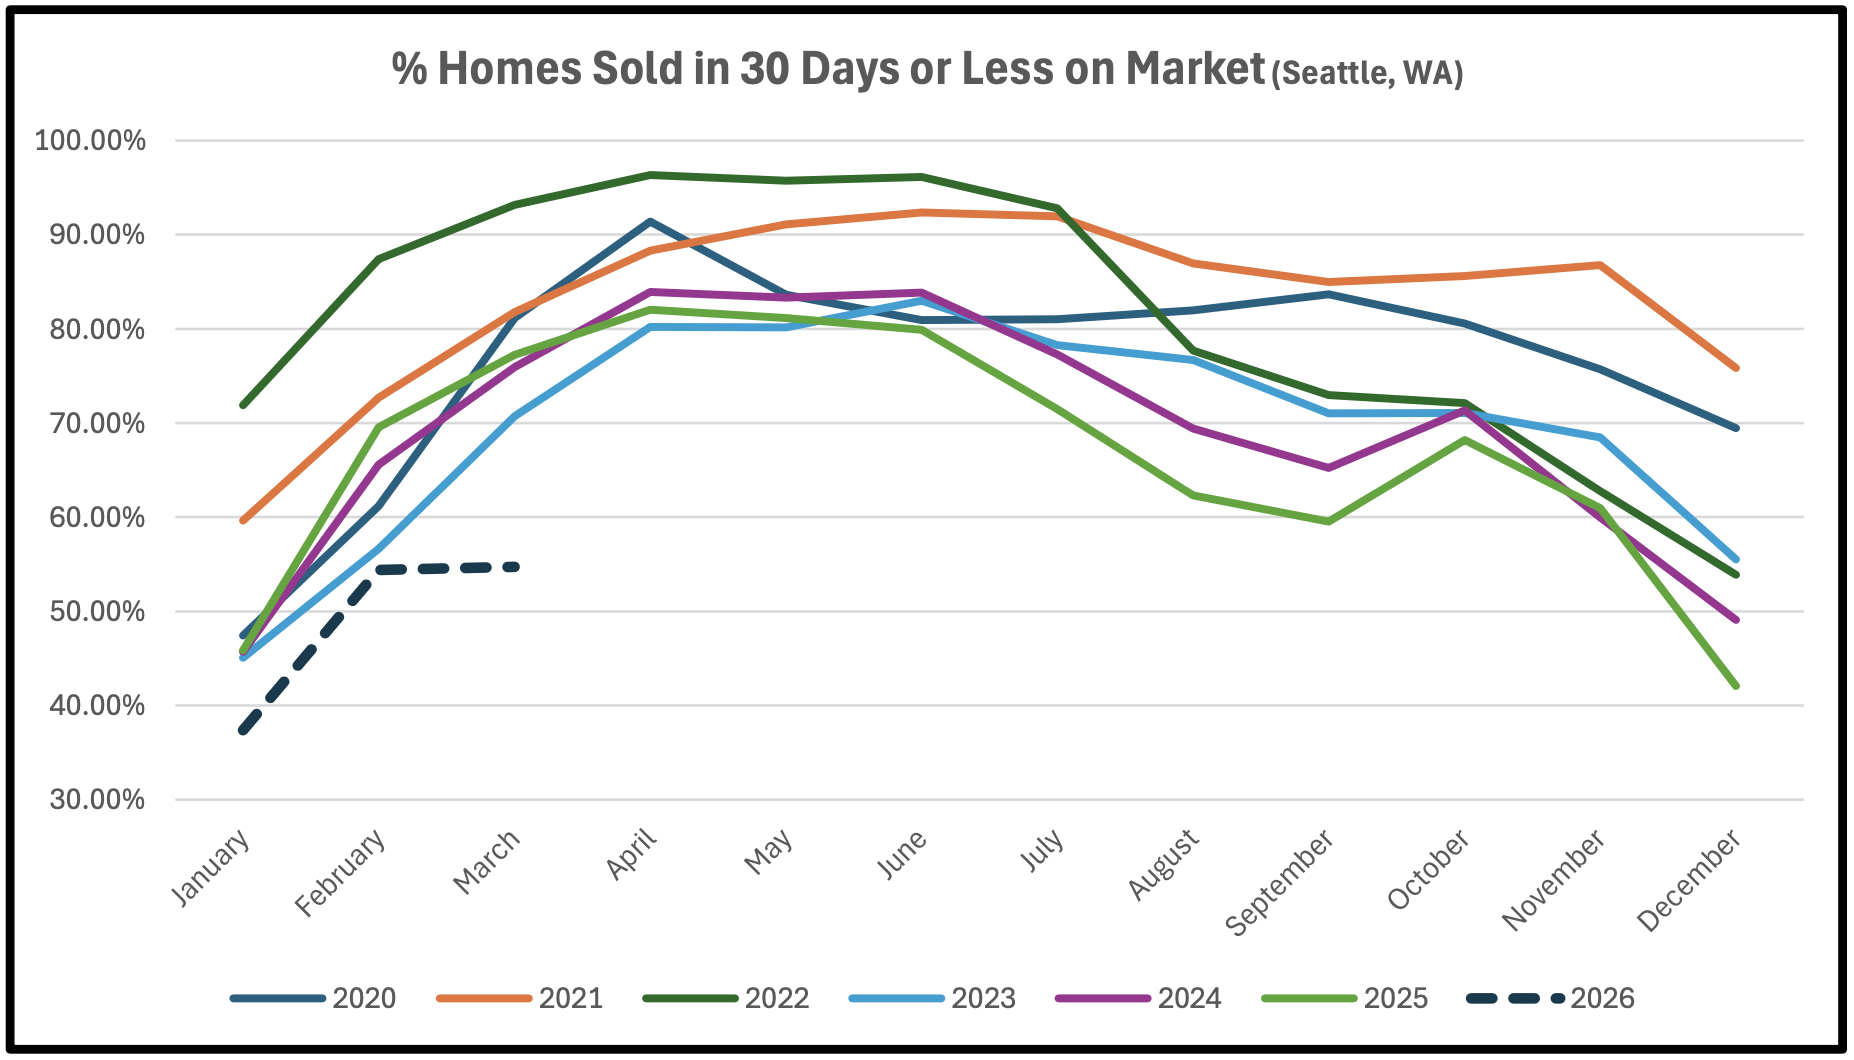
This market is in a fragile state here. Ideally, we want to see continued expansion in transactions volume to absorb the higher inventory levels, and % of Sales <10 and <30 Days increase. With the Superbowl behind us, the next 2 weeks will determine whether we build sustainable momentum into the Spring market or stall out.
Show Me the Data
What This Means
For Sellers: Execution window is immediate and preparation and pricing must be spot on. The first 10–14 days usually determine outcome, where February projections are showing 40% of homes are selling within 10 days, and 50% within 30 days.
For Builders: Spec inventory requires sharper segmentation; Condition, light, layout, and finish quality matter. Momentum metrics now matter more than annual averages with disciplined release timing.
For Buyers: Opportunity exists where inventory has accumulated, and seller expectations haven’t yet adjusted.
If you’re navigating Seattle’s market this season — whether buying, selling, or both — let’s connect to tailor a strategy that leverages these evolving dynamics. Reach out anytime!
Anton K. Alexander | 425.777.7747
Madeline Vujovich | 206-949-2515
By Anton K. Alexander | Elev8 Realty Group | Compass
425.777.7747 · anton@elev8realty.com