
Backward-Looking Data
Most real estate market reports are built on closed sales data — transactions that reflect decisions made 30 to 60 or more days before the numbers are published. By the time that data reaches a headline, the market has already moved.
For homeowners trying to price a property today, or buyers evaluating whether to act now or wait, backward-looking data creates a gap between what the reports say and what the market is actually doing.
After 20 years of brokering transactions across Seattle and the Eastside, you learn to read the signals that closed data doesn’t capture — the pace of showings, the tone of offers, the speed at which well-priced homes move versus sit. These are the indicators that tell you a market is shifting before the published numbers confirm it.
What the Market Pulse Measures
The Market Pulse is a real-time index developed by Anton Alexander at Elev8 Realty Group that measures market pricing momentum across the Seattle residential market. Rather than relying solely on closed sales data, it incorporates pending activity, absorption rates, and velocity metrics — indicators that reflect current market conditions and where the market is’s heading, not where it’s been.
The index is expressed as a percentage. A positive reading indicates accelerating momentum — prices firming, homes selling faster, demand outpacing supply. A negative reading indicates deceleration — softening demand, longer selling timelines, inventory building faster than the market can absorb.
The published figure is always a two-month smoothed average. Single-month readings can be distorted by seasonal patterns, weather events, or a single project with several closings in rapid succession can distort one month’s data. The two-month smoothing filters that noise and surfaces the underlying trend.
The Market Pulse Index
A composite momentum reading that captures the overall direction and speed of the market, accounting for pending activity, pricing trends, and absorption dynamics — all standardized to enable clean month-over-month and year-over-year comparison.
When you see a reading like +2.28%, the market is accelerating with prices rising. When you see -4.07%, it’s decelerating and prices are softening. The magnitude tells you how fast. The direction tells you which way.
We back-tested this index against every month since 2020, and it identified every major inflection point: the COVID shock of early 2020, the 2021 surge, the 2022 rate shock, and the 2025 inventory expansion — weeks and in some cases months before the closed data and the market reports that followed confirmed what we were already seeing.

Alongside the Market Pulse Index, we track and publish four supporting indicators that add dimension to the headline reading: the percentage of homes sold within 10 days (our sharpest measure of buyer urgency), the percentage sold within 30 days (the broader absorption picture), average days on market, and the sale-to-list price ratio. Together, these metrics reveal whether the market is moving in unison or bifurcating — and whether pricing power is strengthening, holding, or softening beneath the surface. All five indicators are published monthly in our newsletter with multi-year comparison charts going back to 2020.
How We Use It
The Market Pulse isn’t published for entertainment. It’s a working tool.
The difference between releasing a listing — or a spec project — into a +5% Pulse reading versus a -4% reading can be the difference between selling out at ask and carrying inventory for months. That’s why timing intelligence matters more than annual averages.
For our sellers and builders, the index serves as an early warning system. If the Pulse reading is trending negative heading into spring, we adjust pricing strategy, marketing timeline, and preparation sequencing before the broader market catches up to what the data is showing. Back-testing confirmed: the Pulse was flashing caution by March 2025, and by April confirmed a momentum slowdown comparable to the 2022 rate shock. The sellers who responded early were positioned well. Those who waited for the closed data to confirm what was happening priced into a market that had already shifted beneath them.
For our buyers, the velocity metrics reveal where opportunity exists. When days on market are stretching and the 10-day absorption rate is declining, that’s the window where negotiation leverage increases and accumulated inventory creates options that didn’t exist three months prior.
As Einstein might say — it’s all relative. The value isn’t in the absolute number. It’s in the comparison: this month versus last month, this spring versus last spring, this cycle versus the last cycle. The Market Pulse gives you that frame of reference in real time.
The Data Behind It
Our Market Pulse tracking monitors pending and closed activity across a Seattle selection that we believe best reflects the city and its market as a whole. The data set is curated — not a raw MLS dump, but a defined, consistent sample that allows for meaningful month-over-month and year-over-year comparison without the distortion that comes from changing geographic boundaries or property type mix.
The raw data is smoothed to account for irregularities and adjusted in a consistent manner so that we can understand what the underlying prices, demand, and supply are actually doing under the hood.
Does Selling in Summer Get You a Higher Price?
There is a persistent misconception in our market that summer months produce the highest prices, and that therefore summer is the best time to sell. The median price data appears to support this. But the median price data is misleading.
The summer months consistently see the largest and most significant homes come to market. These are sellers who planned their sale well ahead of time, waiting for the ideal season to present a property — curb appeal at its peak, daylight lasting late into the evening, buyers emotionally primed. These homes also tend to take longer to sell. They may come to market in April or May but not close until July or August. When they do, they pull the median price up — not because the market is stronger, but because the homes closing are bigger.
Look at the data across six years. The average home sold in July in our Seattle selection is 2,000+ square feet. In February, it’s 1,820. That’s a 10% size difference. When a larger home closes at a higher price, the median moves — but the per-square-foot pricing and competitive intensity were actually stronger months earlier.
The reality is that the highest price per square foot and strongest pricing power — measured by sale-to-list ratio — are seen in March through May. That’s when buyer urgency peaks, competition is fiercest, and sellers consistently receive the most above their asking price. By summer, pricing power is already softening even as the headline median price climbs.
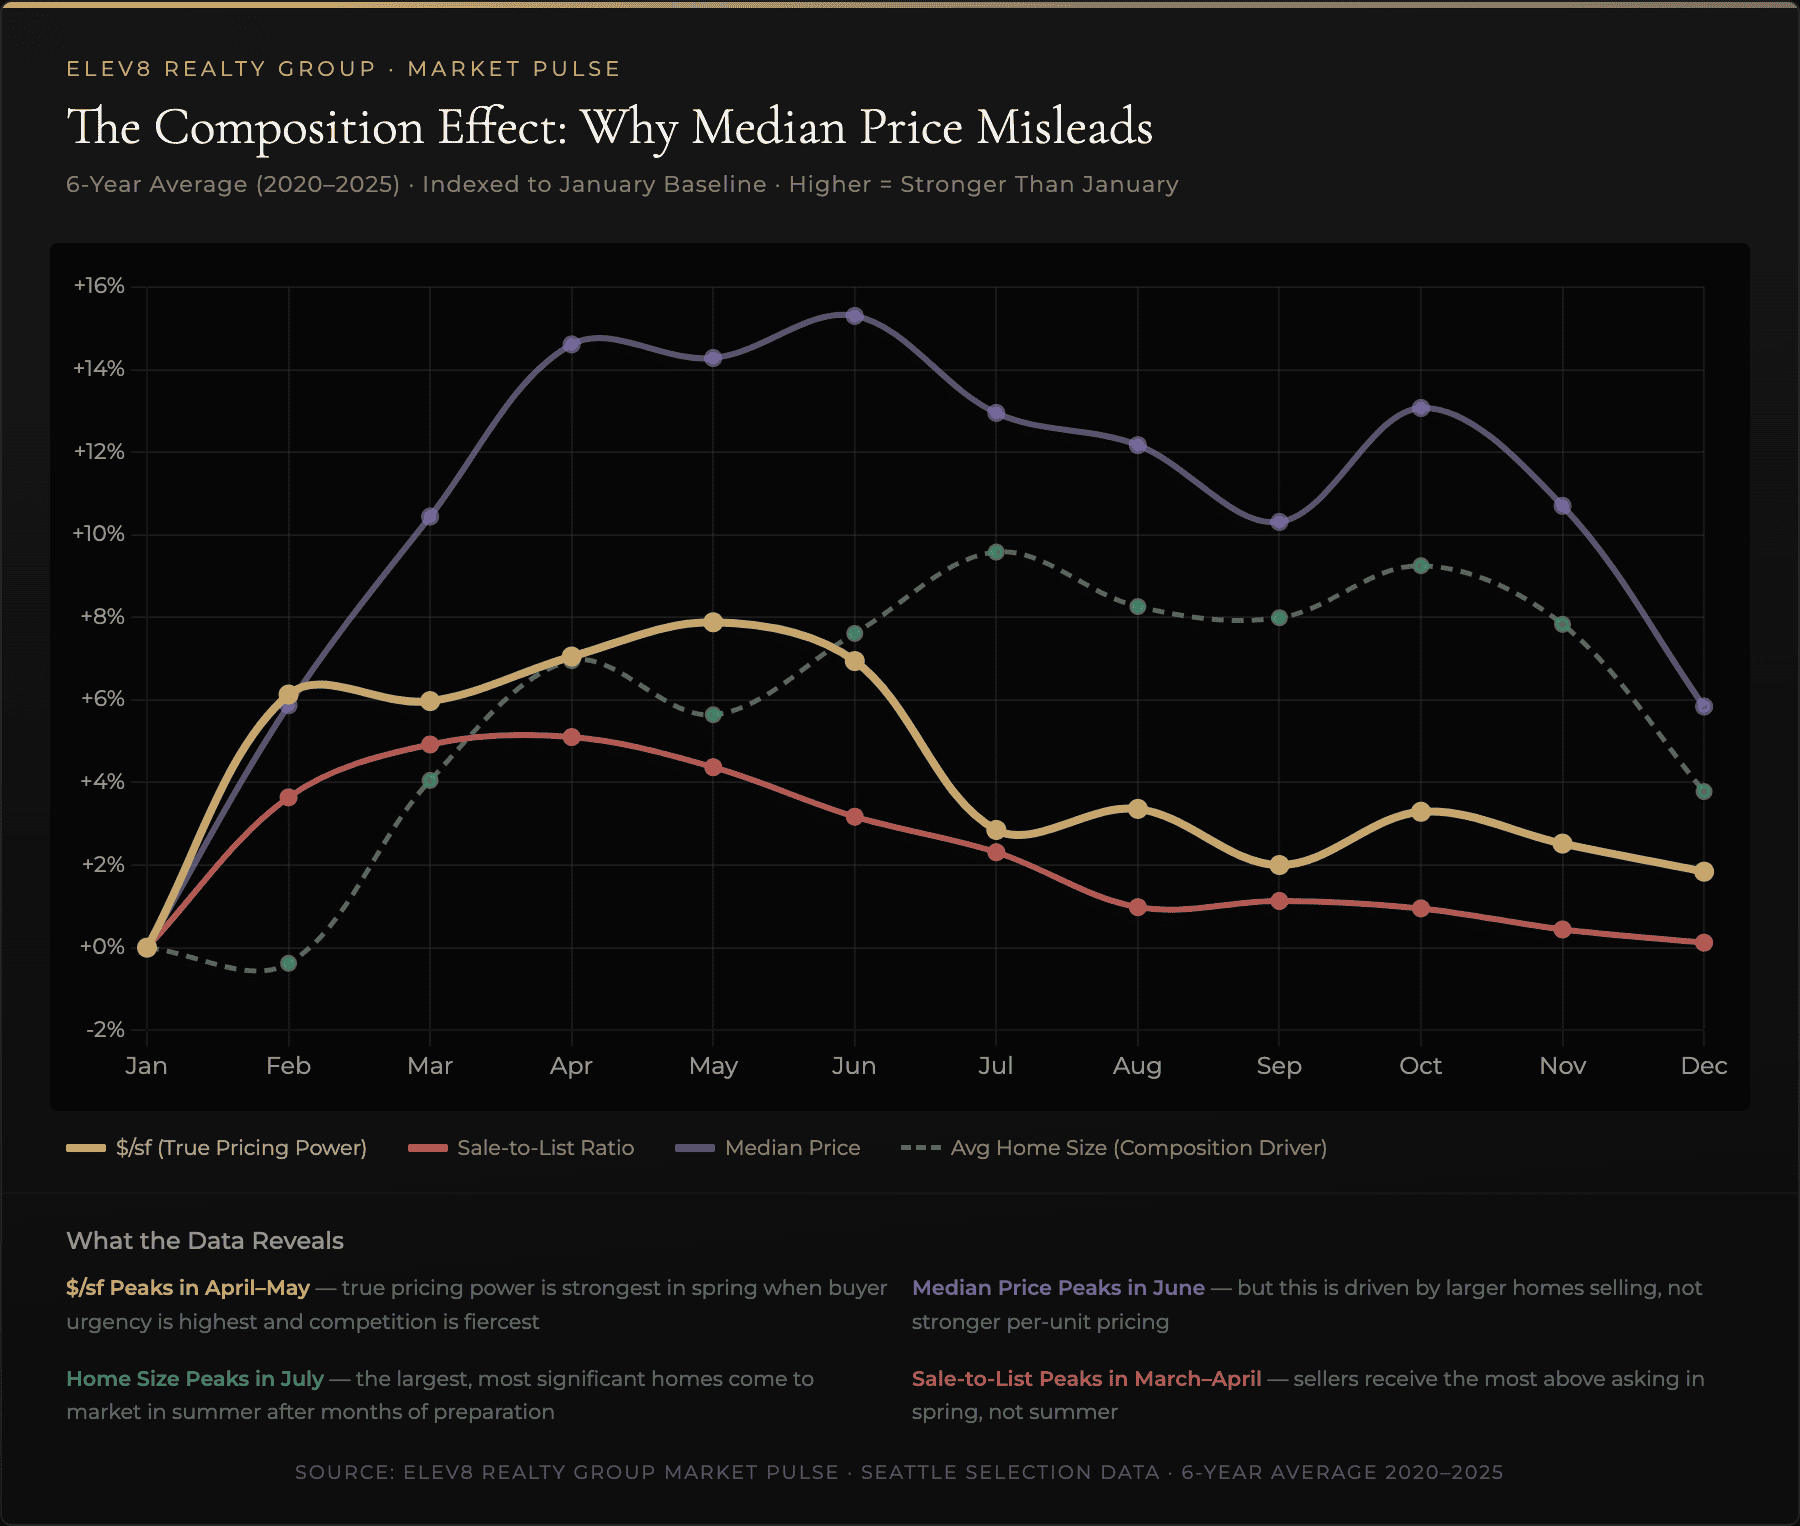
Does median price tell you what the market is actually doing? Not on its own. To understand real pricing behavior and how a market is moving, you have to look beyond the headline numbers. That’s what the Market Pulse does. It accounts for these disparities, adjusting the data in a consistent manner that makes it easy to compare month-over-month and year-over-year — so our buyers and sellers can position themselves based on what the market is doing right now, not what the closed data said it was doing 30 or 60 days ago.
Stay Ahead of the Market
The Market Pulse is updated each month as part of our newsletter. Each edition includes the current index reading, all five indicator charts with multi-year comparisons, and editorial analysis of what the data means for buyers, sellers, and builders in the current market cycle.