
July 11, 2026 · Market Report
Originally shared with Elev8 Realty Group clients on July 11, 2026.
What a 0.08% June Says About the Second Half.
There is more selection on the market right now than at any point this year. NWMLS put out its June numbers last week and active listings across the service area hit 23,088, up 16% from a year ago and 8% just from May. King County’s median landed at $889,000, a touch above May but about 3% below last June. More choice is slowly taking the edge off prices. That’s the backdrop. Here’s what we’re seeing.
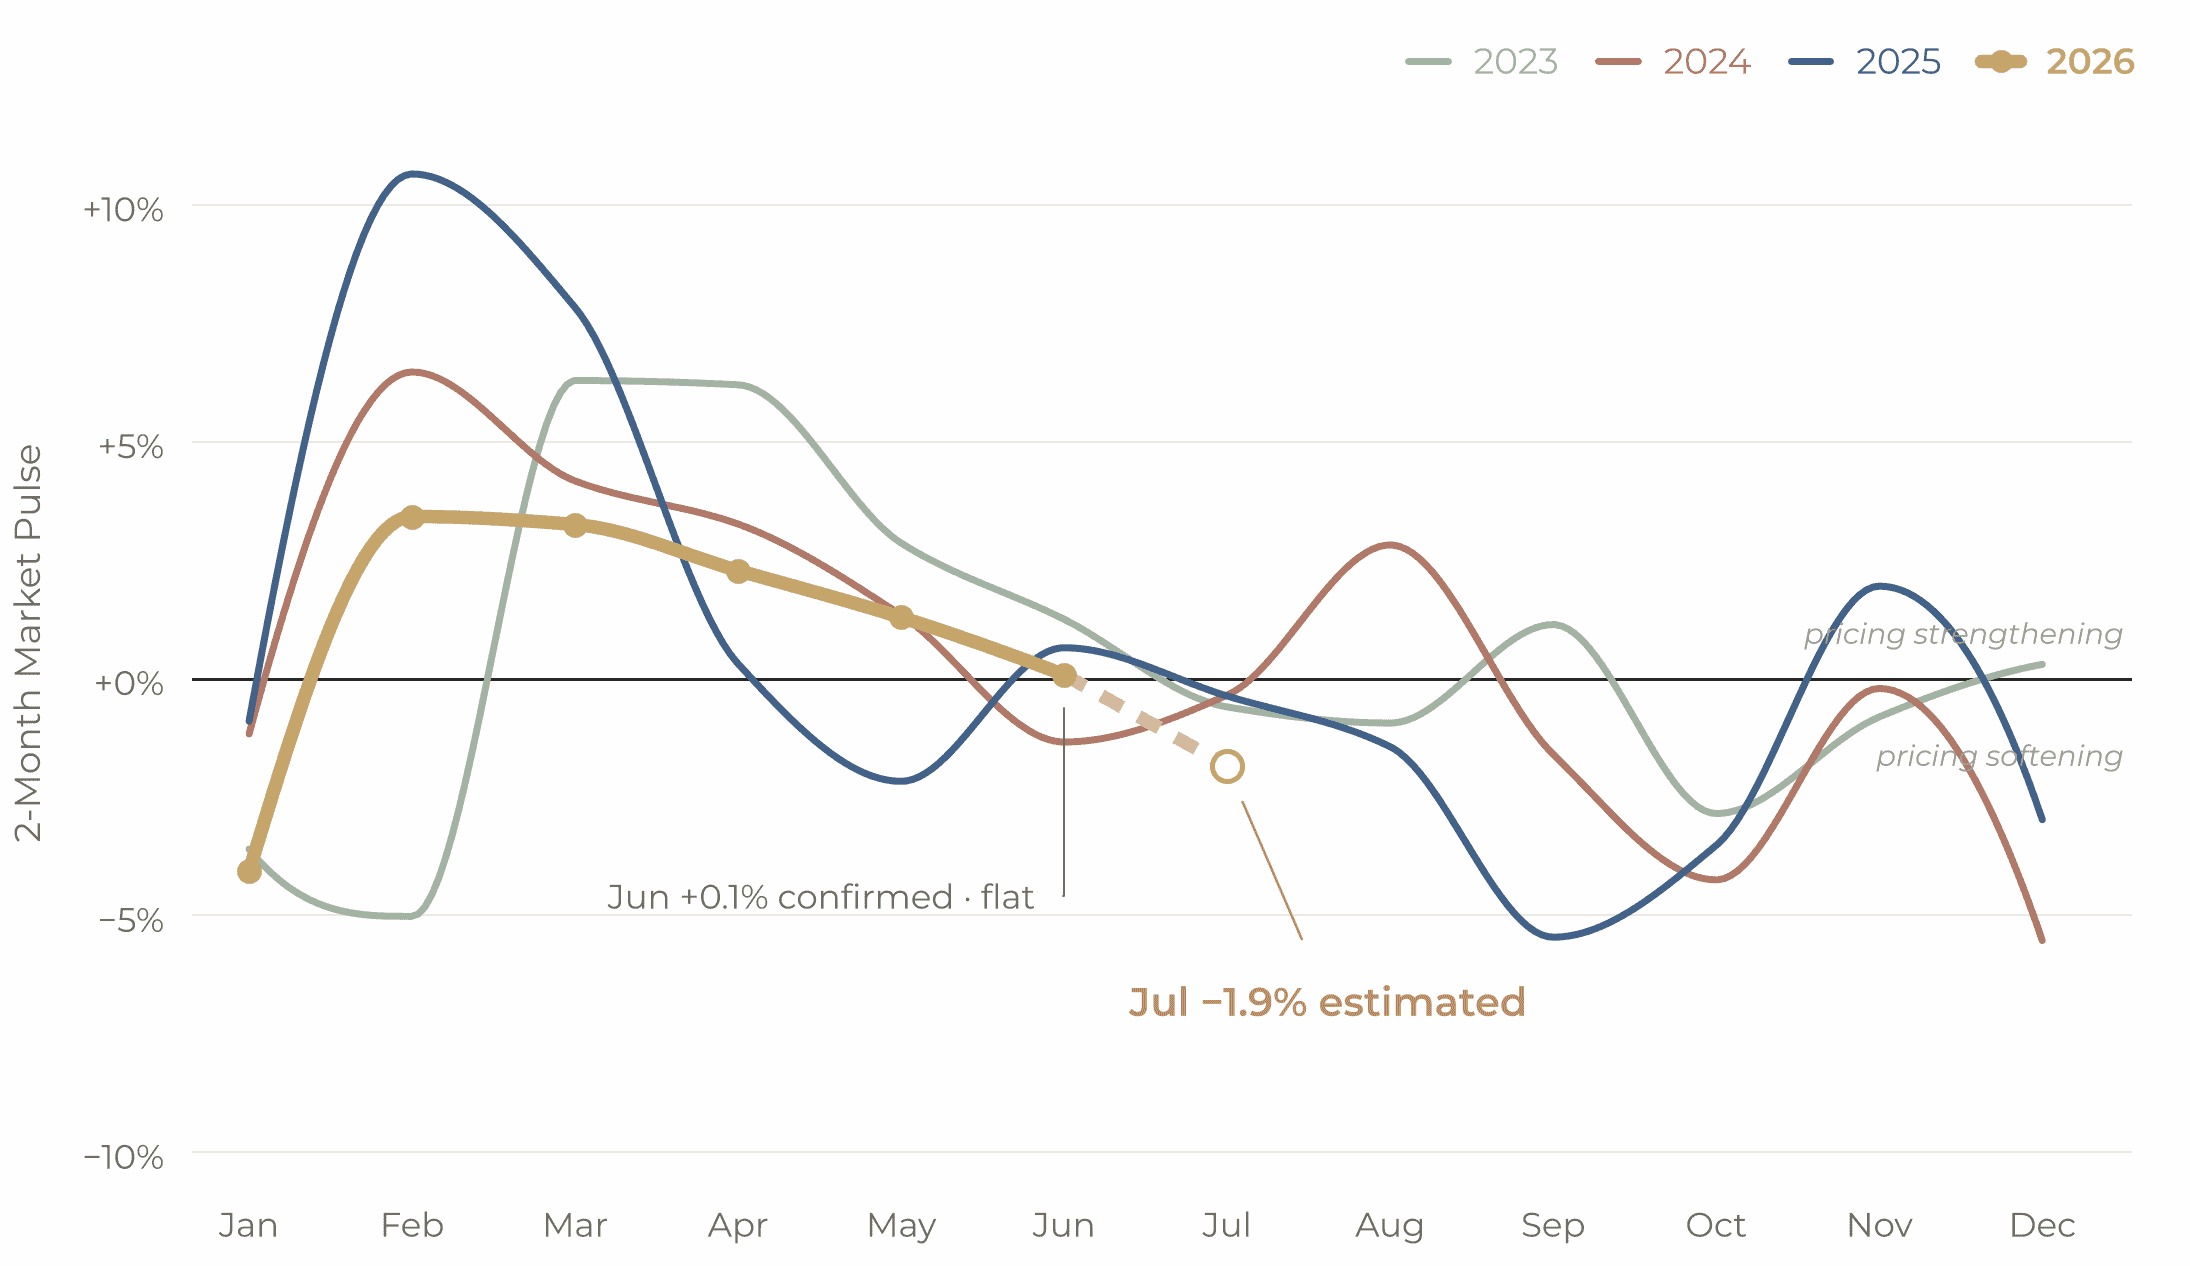
June confirmed at +0.08% on the Market Pulse. We had projected +0.4%, so directionally right and a touch optimistic for the second month running. Pricing momentum in June was neither building nor bleeding. And underneath the flat line, velocity improved: For those homes that are selling, days on market dropped to 24.9, the fastest month of 2026, with half of those homes under contract inside 10 days and three quarters in under 30. Sellers who priced correctly got quick, clean outcomes. The market wasn’t weakening in June but there is a divide growing with those that sell, selling almost immediately while other properties sit.
The Macro Gave Neither Side an Argument
June added 57,000 jobs against a forecast near 110,000, and the prior months were revised down on top of the miss. After May’s blowout report that’s a real cooling, and it pulled the odds of a July rate hike back down almost immediately. The 30-year fixed has settled in the mid 6s, well above February’s 5.98% low but at least for now, staying stable.
The Fed meets again July 28th. Between inflation that won’t finish the job and a labor market that’s starting to show a wobble market analysts think they’re boxed in. For a market this sensitive to financing costs, boring is almost good news.
49.9%
Sold in first
10 days on market
75.5%
Sold within
30 days on market
25 days
Avg. days on
market to sell
100.8%
Sale-to-list ratio
vs. asking price
Two Charts · The Midsummer Picture
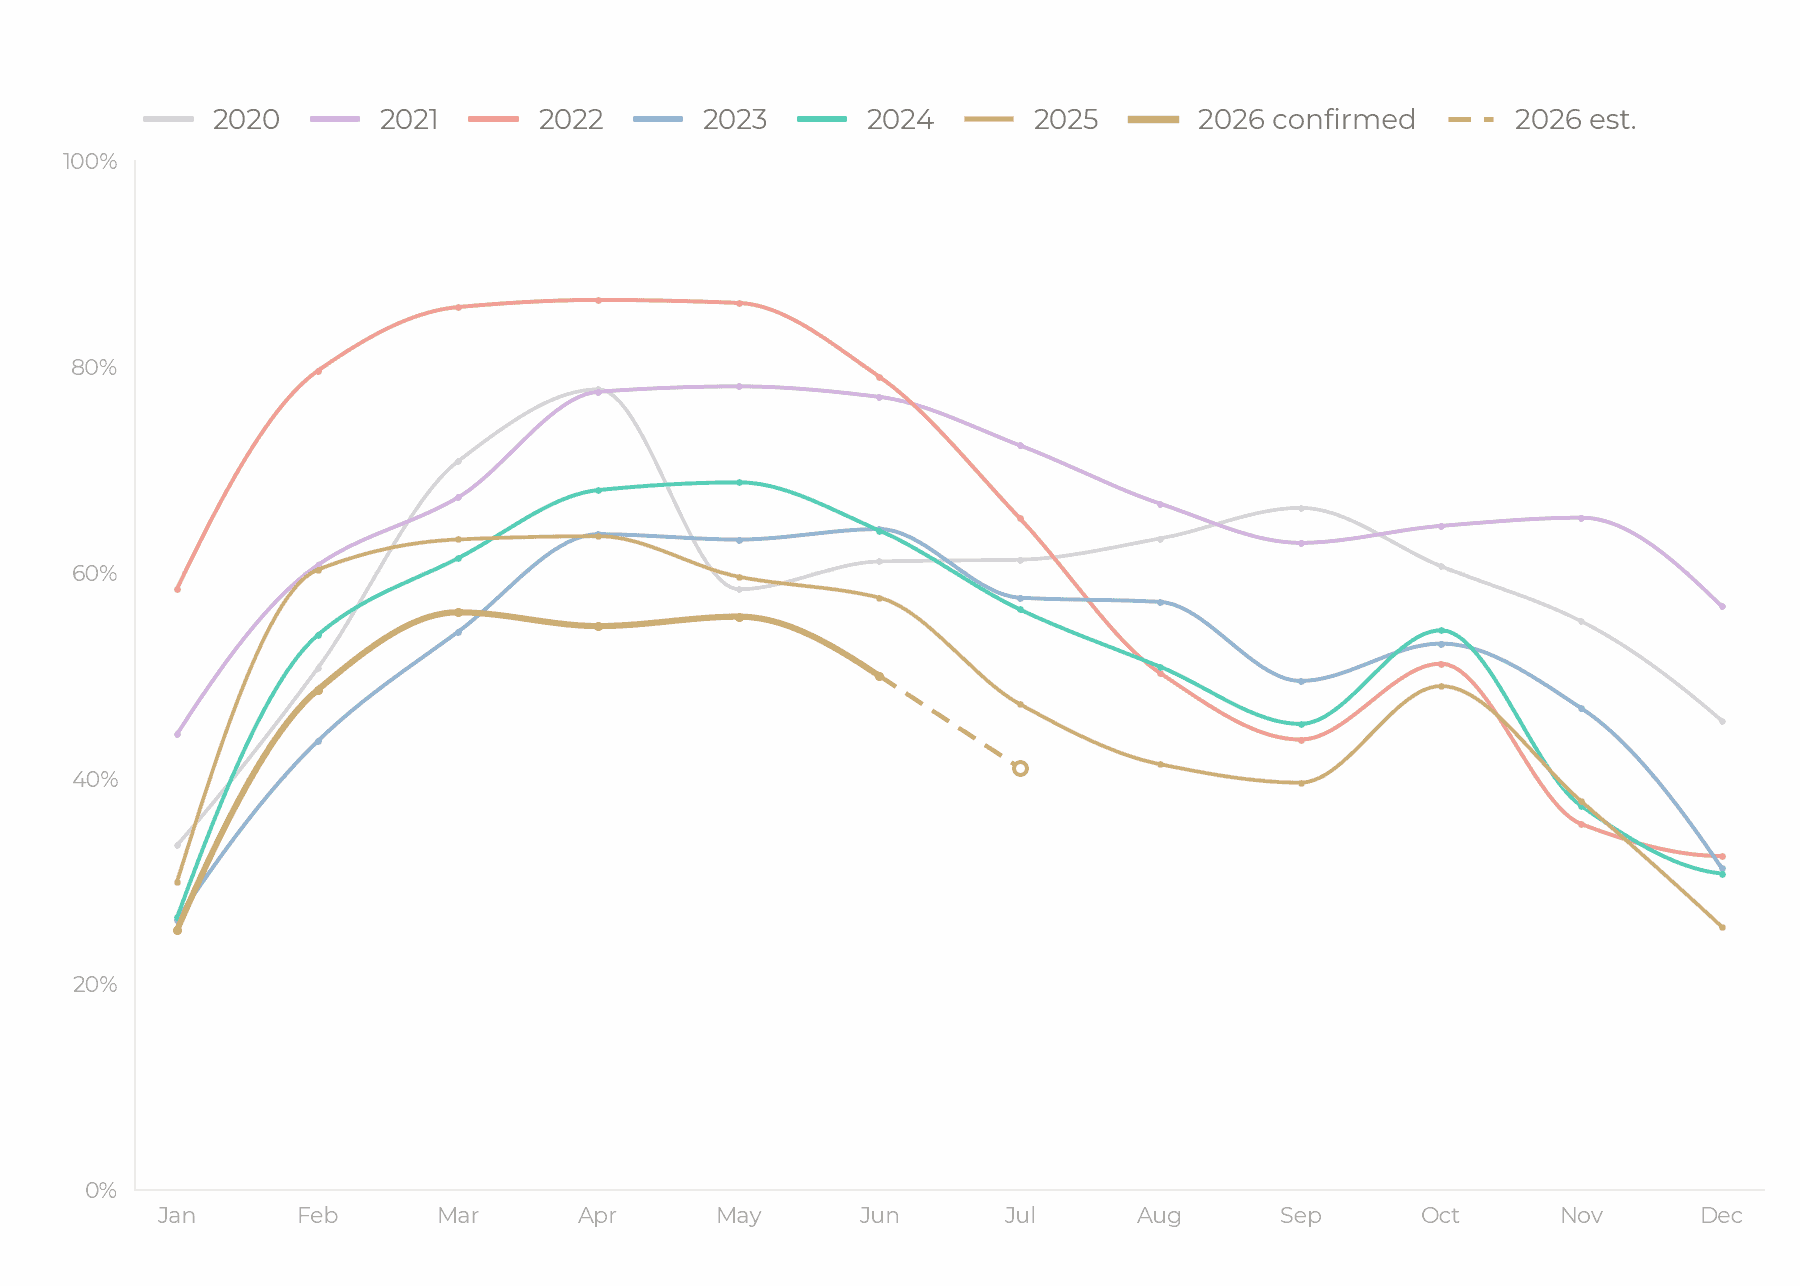
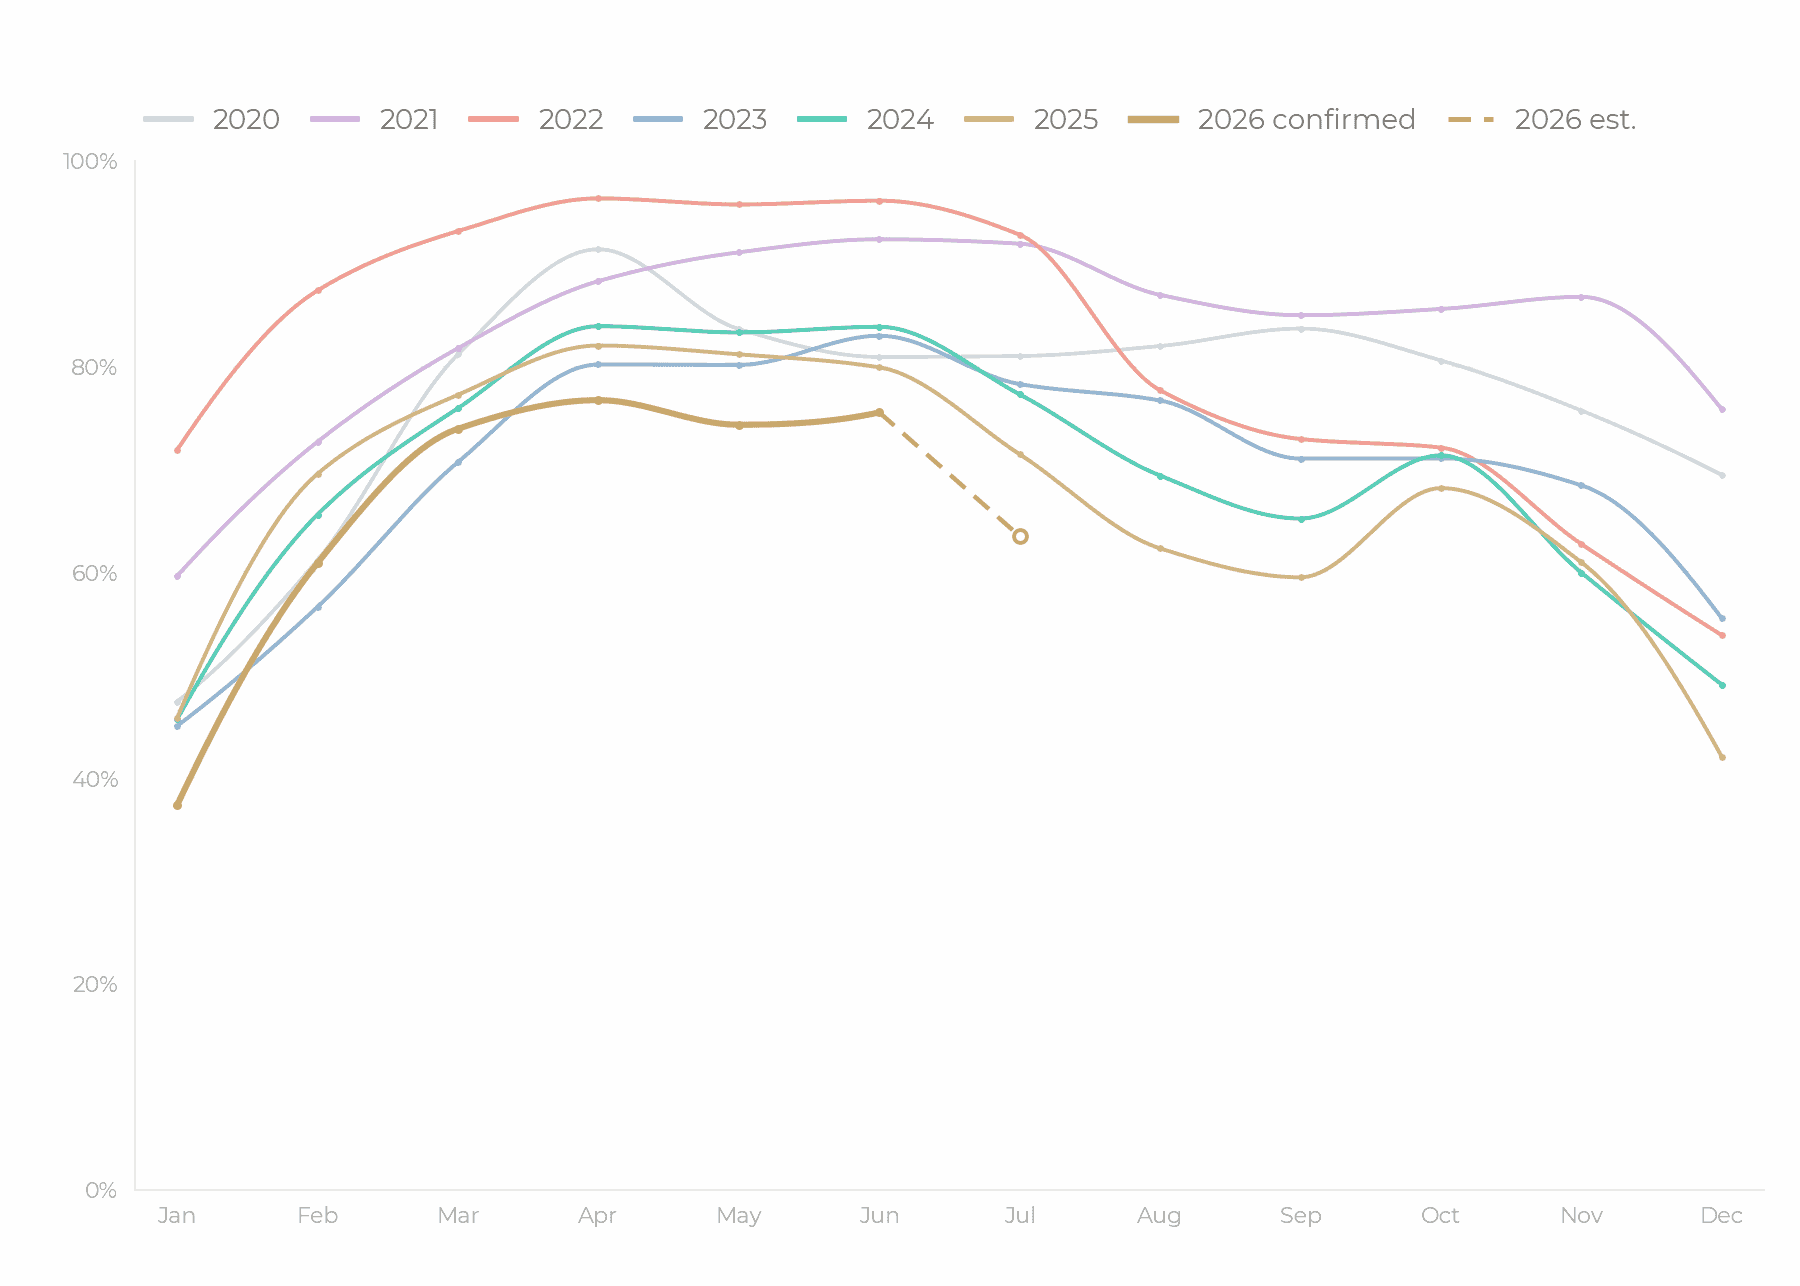
The gold line is 2026 confirmed through June; the dashed extension is the July estimate. Historical years are shown for context.
The First Negative Print Since January
Now the forward look. The leading estimate for July comes in at −1.9%, with ten day velocity projected to drop to about 41% and days on market stretching back toward 36. Some of that is the season, July softens on our charts every single year. The depth of this one is worth respecting though, especially with the model having leaned optimistic twice in a row.
If you’re selling, the window I described in June is closing on schedule. Price for the July market in front of you, not the May market you watched your neighbor sell into, and treat the first ten days as the whole game. If you’re buying, a yearly high in inventory arriving at the same time as the first negative momentum print since winter is the best negotiating setup 2026 has offered. Most people will read this chart in September. You’re reading it now.
August’s confirmed numbers will tell us whether that −1.9% was the season or a signal for more weakness to come, and the grade will be here either way.
If you’re weighing a move this summer, buying or selling, reach out. We’ll sit down, look at your goals and timing against the data, and create a custom tailored plan of action for you.
— Anton
Anton K. Alexander is a Broker with Elev8 Realty Group at Compass.
17+ years in Seattle real estate. $700M+ in career sales representation.